
Blog article
pandas groupby explained: split, apply, combine
One idea, split-apply-combine, explains every pandas groupby. Totals, named agg, two-column groups, transform and filter, with diagrams, real output and four mistakes to avoid.
On this page13 sections
You have a table of study sessions and three questions: how many minutes went to each subject, which learner studied most, and what share of each learner’s time each session represents. In plain Python that takes a loop, a dictionary and some care. In pandas, grouping answers each question once you understand one idea: split, apply, combine.
If you worked through Group and aggregate records in the Python roadmap, you have already done grouping by hand:
The loop version
A dictionary holds one running total per subject. It works, but every new question (an average, a count, two columns at once) means another loop.
from collections import defaultdict

rows = [("Python", 30), ("SQL", 45), ("SQL", 20), ("Python", 25),
        ("Python", 40), ("Python", 35), ("SQL", 50), ("SQL", 10)]
totals = defaultdict(int)
for subject, minutes in rows:
    totals[subject] += minutes
print(dict(totals)){'Python': 130, 'SQL': 125}The sessions table
Every example uses this small DataFrame. Run it once, then run each snippet below in order, in the same session: none of them changes sessions, so your output will match.
Create the data
Eight sessions, three learners, two subjects.
import pandas as pd

sessions = pd.DataFrame({
    "learner": ["Ana", "Ben", "Ana", "Cara", "Ben", "Ana", "Cara", "Ben"],
    "subject": ["Python", "SQL", "SQL", "Python", "Python", "Python", "SQL", "SQL"],
    "minutes": [30, 45, 20, 25, 40, 35, 50, 10],
})

print(sessions)learner subject minutes 0 Ana Python 30 1 Ben SQL 45 2 Ana SQL 20 3 Cara Python 25 4 Ben Python 40 5 Ana Python 35 6 Cara SQL 50 7 Ben SQL 10
Split, apply, combine
groupby does three things. It splits the rows into groups that share a value, applies a calculation to each group separately, and combines the answers into one result with a row per group.
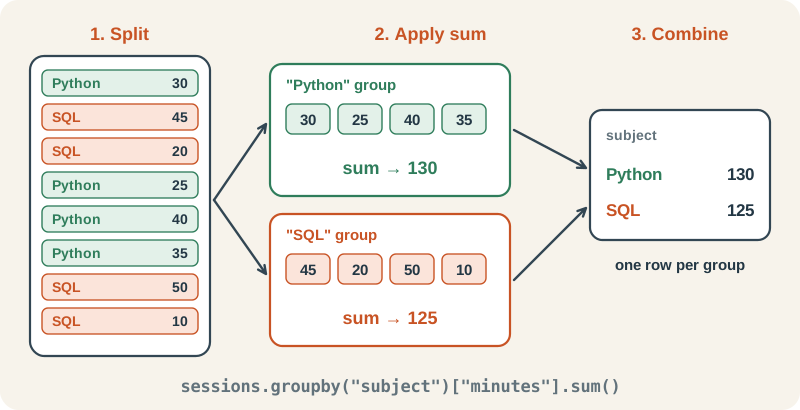
Total minutes per subject
Read it left to right: group the sessions by subject, take the minutes column, sum each group. The result is indexed by subject.
totals = sessions.groupby("subject")["minutes"].sum()
print(totals)subject Python 130 SQL 125 Name: minutes, dtype: int64
Several answers at once: agg
agg with named results gives you a tidy summary table in one step. Each argument is new_name=(column, function).
Total, count and average per subject
The column names come from the argument names, so the result is ready to show or export.
summary = sessions.groupby("subject").agg(
    total=("minutes", "sum"),
    sessions=("minutes", "count"),
    average=("minutes", "mean"),
)
print(summary)total sessions average subject Python 130 4 32.50 SQL 125 4 31.25
Group by more than one column
Pass a list of columns to make one group per combination. as_index=False keeps the group columns as normal columns instead of moving them into the index, which is usually what you want for the next step.
Minutes per learner per subject
Six combinations, one row each. Ana’s two Python sessions (30 and 35) became 65.
per_learner = sessions.groupby(["learner", "subject"], as_index=False)["minutes"].sum()
print(per_learner)learner subject minutes 0 Ana Python 65 1 Ana SQL 20 2 Ben Python 40 3 Ben SQL 55 4 Cara Python 25 5 Cara SQL 50
Keep every row: transform
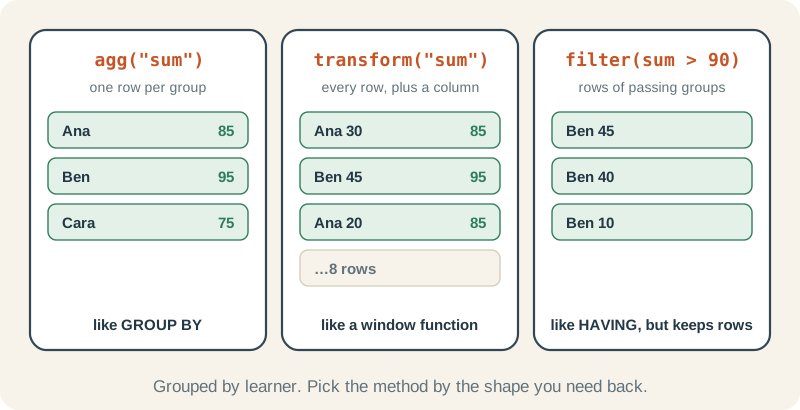
Sometimes you want the group answer beside each original row, for example to work out what share of a learner’s time each session was. agg cannot do that because it returns one row per group. transform runs the same calculation but returns a value for every row, lined up with the original table.
Each session as a share of the learner’s time
Every row now knows its learner’s total, so dividing is ordinary column arithmetic. Cara’s SQL session was 67% of her study time. The new columns go on a copy, shares, so sessions stays the same for the examples that follow.
shares = sessions.copy()
shares["learner_total"] = shares.groupby("learner")["minutes"].transform("sum")
shares["share"] = (shares["minutes"] / shares["learner_total"]).round(2)
print(shares)learner subject minutes learner_total share 0 Ana Python 30 85 0.35 1 Ben SQL 45 95 0.47 2 Ana SQL 20 85 0.24 3 Cara Python 25 75 0.33 4 Ben Python 40 95 0.42 5 Ana Python 35 85 0.41 6 Cara SQL 50 75 0.67 7 Ben SQL 10 95 0.11
Keep whole groups: filter
filter keeps or drops entire groups based on a test you write. The function receives one group at a time as a small DataFrame and returns True or False.
Sessions of learners with more than 90 minutes in total
Ana has 85 minutes and Cara 75, so only Ben’s three sessions remain. Note that the result is the original rows, not a summary.
busy = sessions.groupby("learner").filter(lambda g: g["minutes"].sum() > 90)
print(busy)learner subject minutes 1 Ben SQL 45 4 Ben Python 40 7 Ben SQL 10
Four mistakes to avoid
1. Forgetting the group key moved into the index
A grouped sum returns a Series whose index is the subject. If the next step expects a subject column (a merge, a chart, a CSV export), it will not find one. Use as_index=False or call reset_index().
Turn the result back into a normal table
reset_index() moves subject back into a column and gives the rows a fresh 0, 1 index.
totals = sessions.groupby("subject")["minutes"].sum()
print(type(totals).__name__)
print(totals.reset_index())Series subject minutes 0 Python 130 1 SQL 125
2. Losing rows with a missing group key
By default, groupby drops rows whose key is missing, without a warning. Here an hour of study vanishes because nobody recorded the subject.
Missing subject: dropped unless you ask
The first result adds up to 50 minutes, the second to 110. dropna=False keeps a group for the missing key so you can see the problem and fix the data. (The missing minutes in the last row are skipped by sum in both.)
messy = pd.DataFrame({
    "subject": ["Python", None, "SQL", "Python"],
    "minutes": [30, 60, 20, None],
})
print(messy.groupby("subject")["minutes"].sum())
print(messy.groupby("subject", dropna=False)["minutes"].sum())subject Python 30.0 SQL 20.0 Name: minutes, dtype: float64 subject Python 30.0 SQL 20.0 NaN 60.0 Name: minutes, dtype: float64
3. Mixing up count and size
count skips missing values, size does not
The Python group has two rows, but only one has minutes. Use size() for “how many sessions”, and count() for “how many sessions have a value”.
print(messy.groupby("subject", dropna=False)["minutes"].count())
print(messy.groupby("subject", dropna=False).size())subject Python 1 SQL 1 NaN 1 Name: minutes, dtype: int64 subject Python 2 SQL 1 NaN 1 dtype: int64
4. Averaging averages
Grouping in two steps, first per learner and then per subject, gives every learner equal weight, however many sessions they had.
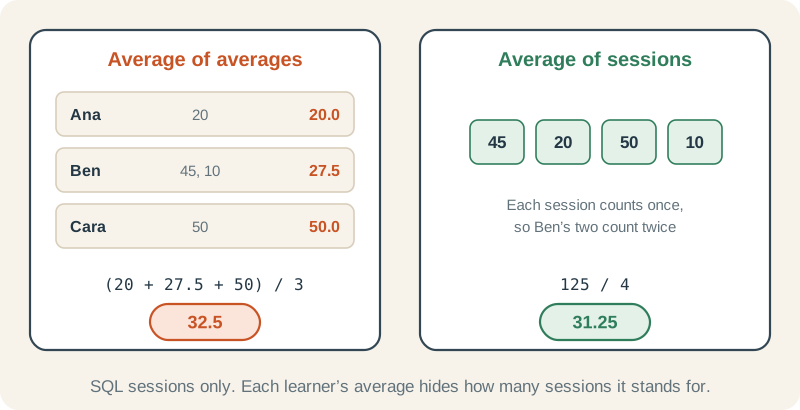
Two averages, two answers
The first line is the average of the learner averages; the second is the true average per session. For SQL they differ: 32.5 against 31.25. Average from the original rows unless equal weight per learner is what you mean.
by_learner = sessions.groupby(["subject", "learner"])["minutes"].mean()
print(by_learner.groupby("subject").mean())
print(sessions.groupby("subject")["minutes"].mean())subject Python 32.5 SQL 32.5 Name: minutes, dtype: float64 subject Python 32.50 SQL 31.25 Name: minutes, dtype: float64
Check yourself
Which learner studied the most in total?
Reveal answer
per_learner_total = sessions.groupby("learner")["minutes"].sum()
print(per_learner_total)
print(per_learner_total.idxmax())
# learner
# Ana     85
# Ben     95
# Cara    75
# Name: minutes, dtype: int64
# Ben
Sum minutes per learner, then idxmax() returns the label of the largest value: Ben, with 95 minutes.
What is each learner’s longest session?
Reveal answer
print(sessions.groupby("learner")["minutes"].max())
# learner
# Ana     35
# Ben     45
# Cara    50
# Name: minutes, dtype: int64
Group by learner and take the max of minutes: Ana 35, Ben 45, Cara 50.
How many sessions did each learner have?
Reveal answer
print(sessions.groupby("learner").size())
# learner
# Ana     3
# Ben     3
# Cara    2
# dtype: int64
Use size(), which counts rows per group: Ana 3, Ben 3, Cara 2.
You want each subject’s total minutes next to every session, so you can flag sessions longer than a quarter of their subject’s total. agg, transform or filter?
Reveal answer
transform, because you need one value per original row: sessions.groupby("subject")["minutes"].transform("sum"). agg would give only two rows, and filter would drop rows rather than add a column.
Where to go next
Chapter 12 of the Python roadmap builds a small data workflow by hand, which is the best way to understand what pandas is doing for you:
- Data records and schema checks
- Clean and validate CSV rows: catch bad values before you group anything
- Group and aggregate records: grouped totals and counts with a plain loop
- Export results reproducibly
- 10 Python one-liners for cleaning messy data